It’s well-known in the field of urban studies that neighborhoods tend to gentrify along subway lines, which give professional commuters ready access to new neighborhoods that have cheaper rents. But can we predict where gentrification will happen next? That’s the question Anna Solow-Collins ’16, GSAS ’17 set out to explore for her master’s thesis in quantitative methods in the social sciences. The good news is New York’s Metropolitan Transit Authority (MTA) provides a wealth of data on commuters. The bad news is that that data is a near-impenetrable mess of raw numbers.
For help translating it, Solow-Collins turned to Barnard’s Empirical Reasoning Center, which, for the past five years, has been helping students understand, analyze, and visualize data of every kind. In her first workshop, Solow-Collins learned how to use GIS (Geographic Information Systems) software to present the data visually. “The first map I ever made just showed for every given zip code how many people had taken the subway that morning,” Solow-Collins says. By her second workshop, she was making animated maps showing how ridership changed over time. In her third, she was able to show which changes were statistically significant enough to demonstrate a trend.
Not only did the maps give her a way to visualize the data, they also suggested new research topics; for example, about how neighborhoods could prepare for an influx of morning commuters or nightlife denizens, or slow some of the negative consequences of gentrification. “Data analysis can be a powerful policy tool to empower neighborhoods,” says Solow-Collins, now a research analyst at Crime Lab New York, a public-academic partnership designing data-driven public safety strategies for the Big Apple. The tools she discovered also empowered her to take on a difficult subject she wouldn’t have been able to otherwise. “I literally could not have completed my thesis without the ERC,” she says.
 Since it opened in January 2013, the ERC has been increasingly upping students’ game in interpreting and visualizing data, helping them learn new tools and techniques through computer workshops, classroom support, and one-on-one peer tutoring. After helping 350 students in its first academic year, the ERC has grown to serve more than 2,000 in 2016-2017.
Next year, the Center will embark on a new chapter, dramatically expanding its physical footprint, which was just slightly larger than 200 square feet when it first opened in the library at Lehman Hall. Next summer, in the new Cheryl and Philip Milstein Teaching and Learning Center, it will be six times larger, with a state-of-the-art classroom where staff members hope they can integrate empirical thinking even more deeply into the College’s curriculum.
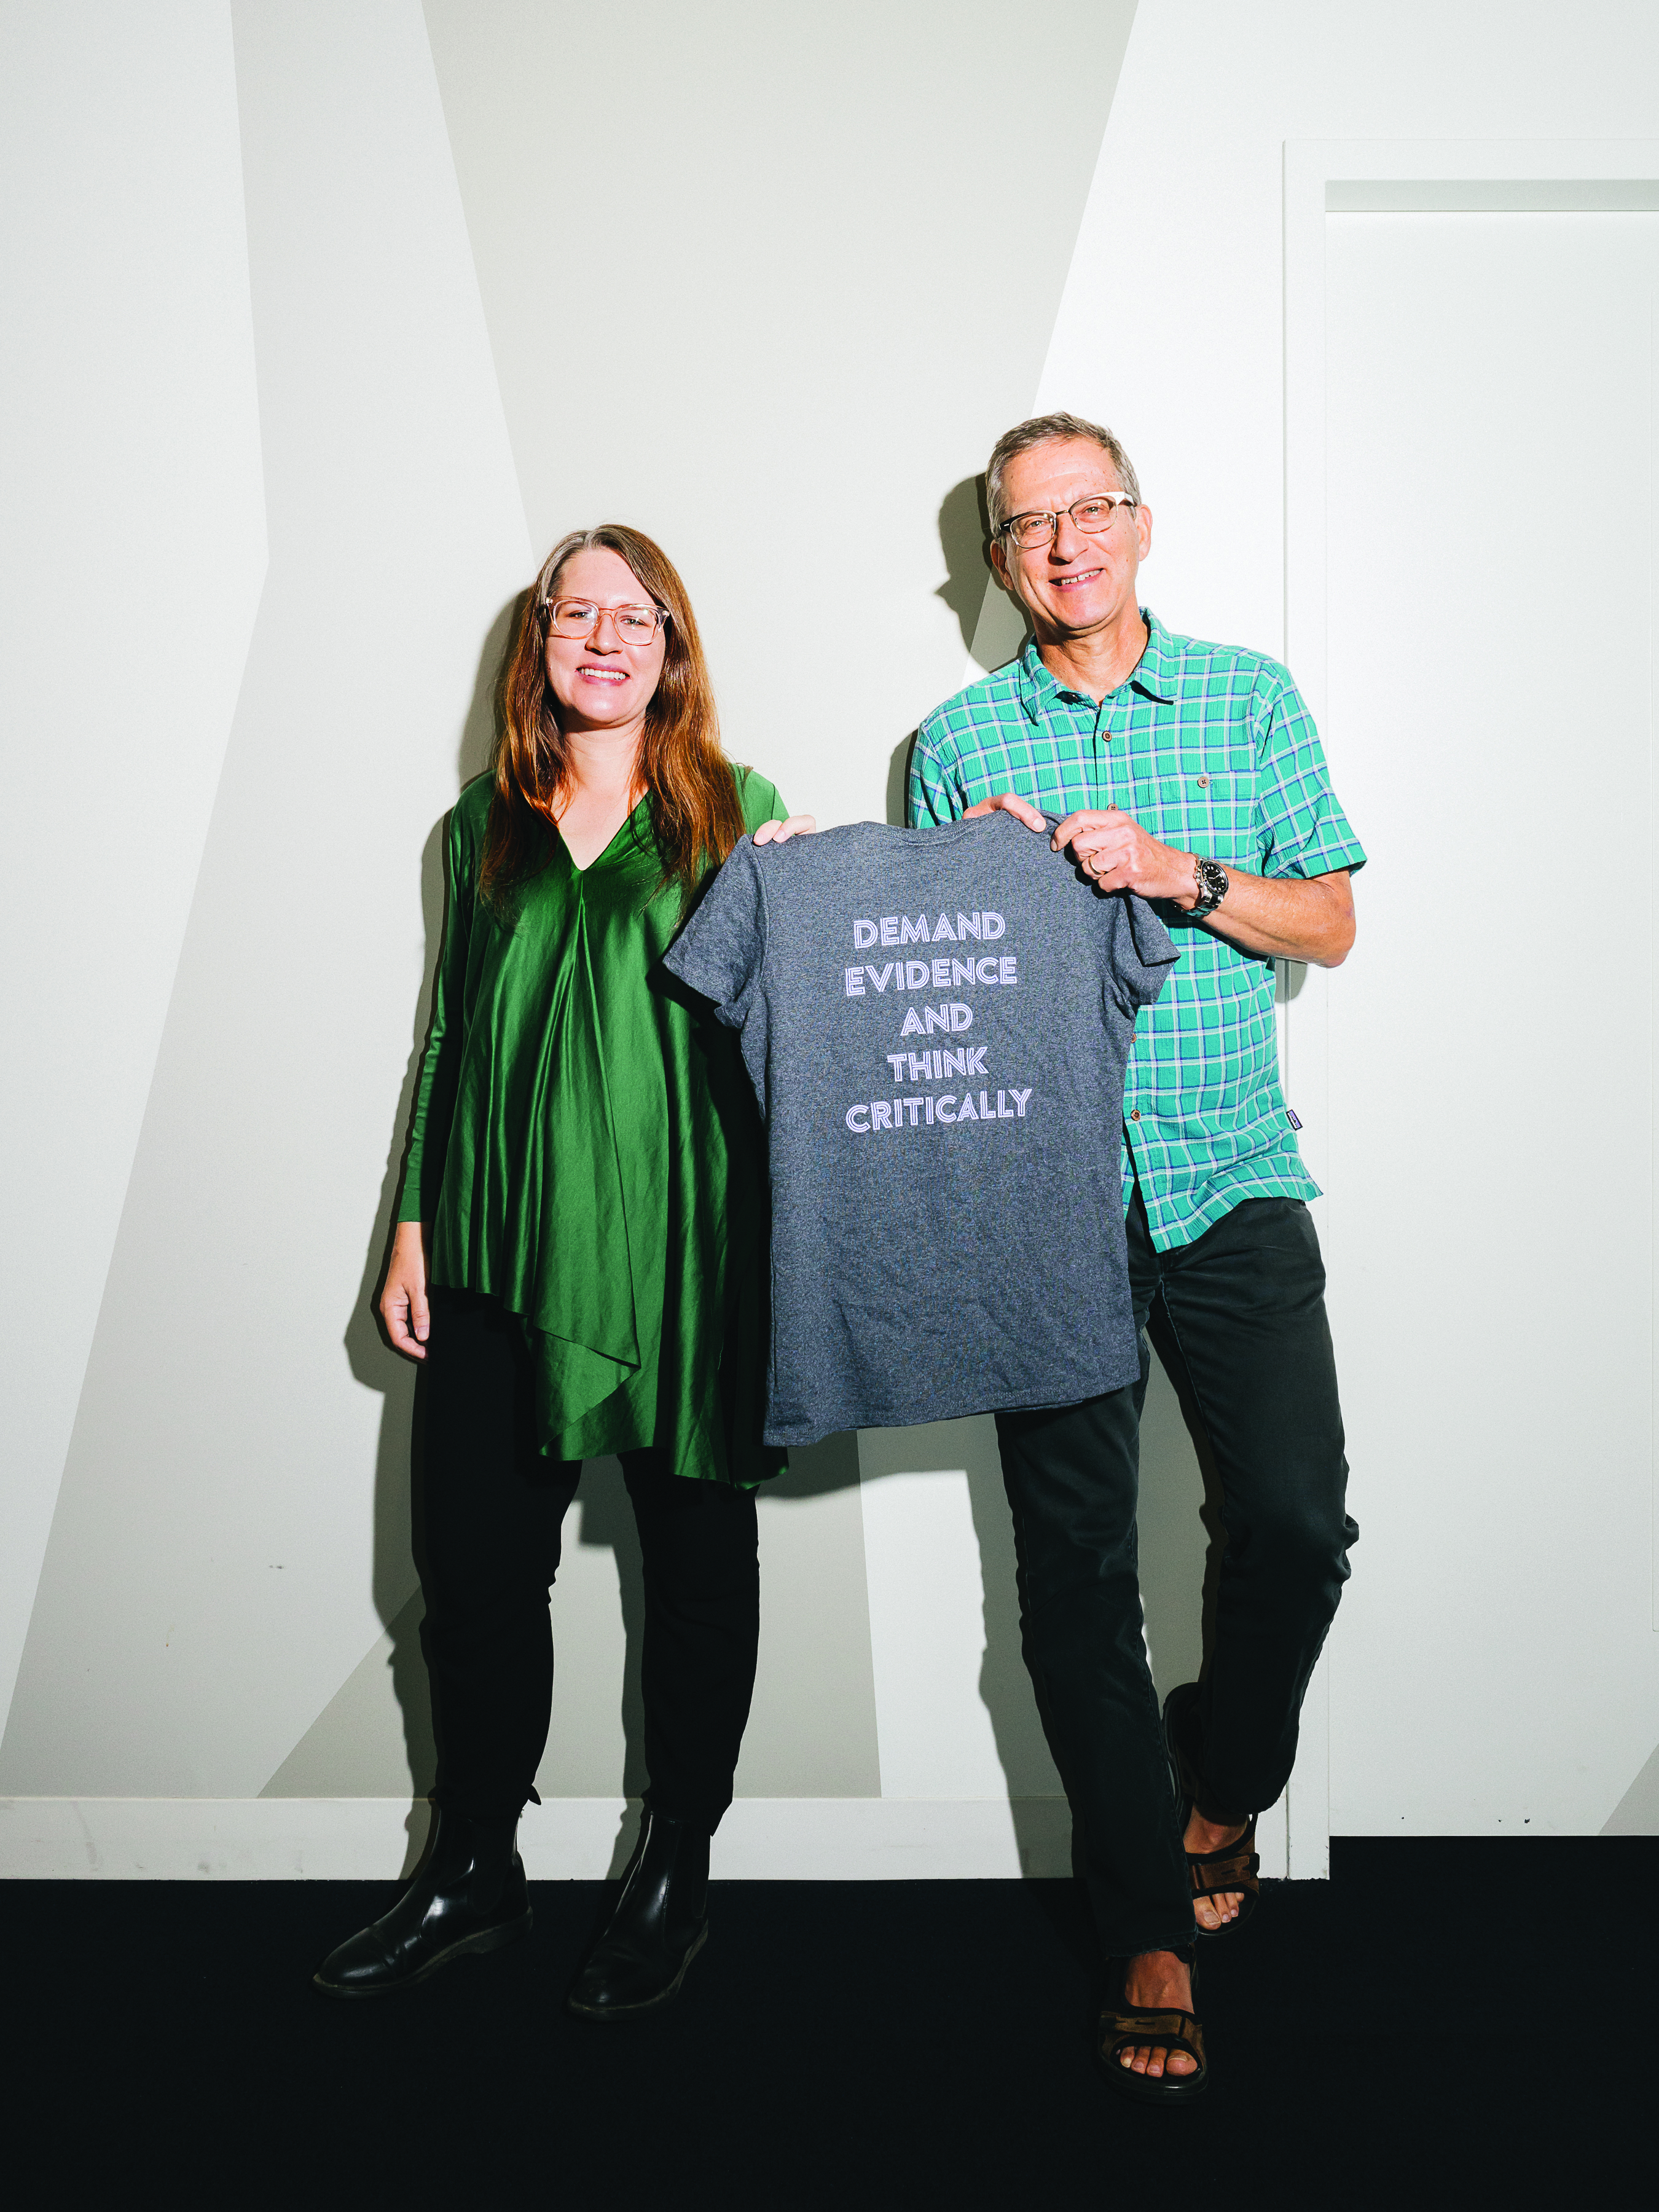
“Most of the problems we confront either in the classroom, the workplace, or our personal lives require that we consider qualitative and quantitative information in a systematic fashion,” says David Weiman, the Alena Wels Hirschorn ’58 Professor of Economics, and faculty director of the Center. “If we are not teaching our students how to do that, they are leaving here with only a partial education.”
A Center is Born
For years after Weiman arrived at Barnard in 2001, he and colleagues noticed an increase in the amount and sophistication of empirical data in social science classes. At the same time, students faced a steep learning curve to keep up. “The world was speeding ahead in the consideration of empirical evidence, and our curriculum was lagging behind,” Weiman says. He proposed a center where students could hone their analytic skills, much in the same way that the Barnard Writing Center hones their grammar and essay structure. That dream became a reality when the Mellon Foundation gave the College a five-year grant for a lab with a full-time director and student researchers who could help close the analytical gap.
“Being able to think critically about data should be part of the set of skills you get in a liberal arts education,” says Associate Director Alisa Rod, who handles day-to-day programming for the Center. One need only look at the ubiquity of polling data and demographics in the last election to see how much data has become part of our daily lives. “When you are reading the newspaper, you want to be able to discern what kind of bias goes into a story and assess whether it is presenting information accurately or in a way that is misleading.”
Taking its lead from initiatives such as Carleton College’s Quantitative Inquiry, Reasoning, and Knowledge (QuIRK) program, the Center first focused on integrating workshops into social science courses. One of the first faculty members to introduce an ERC module, Assistant Professor of History and Urban Studies Gergely Baics, incorporated an Excel workshop into his Shaping of the Modern City course. Students used the software to analyze historic mortality data in five U.S. cities, then wrote short papers in which they hypothesized the causes of the differences in the patterns they found. “The workshop is simple,” says Baics. “But it provides students with basic Excel skills, introduces them to quantitative historical empirical evidence, and—perhaps most importantly—it gives them the confidence to pursue such analysis on their own.”
From the beginning, the Center’s three graduate fellows and one undergraduate worker proselytized to their peers about how the ERC could help them work data into their projects. Then undergrad Emily Arsen ’13, a sociology major, was particularly tenacious about urging her classmates to shore up their arguments with empirical evidence. “It was great to help other students think big-picture about what kind of data would be useful to answer the questions they were asking,” Arsen says.
Though the ERC began reaching out to social science classes first, the staff quickly found they could use the same tools to improve the rigor in science and technology. When the chemistry curriculum underwent an overhaul around the same time as the ERC was newly under way, General Chemistry Lab Director Jacob Alexander reached out to include data visualization tools in the redesign. “Given that a major motivation for our revisions was to modernize our course and expose students to more robust data-processing and visualization technologies, the timing to set up a collaboration was perfect,” he says.
Charts and graphs have always been a part of chemistry. But up until a few years ago, students still meticulously drew them by hand. Those techniques are effective, says Alexander, but they can also be time-consuming and if students made mistakes, they could skew the science. ERC workshops have “meaningfully raised the baseline of performance” in the entry-level chemistry classes, Alexander says. Moreover, “we are already starting to see a spillover effect in our upper-level chemistry and physics courses, as students are arriving much better-prepared to perform complex analyses than they were in the past.”
More recently, the ERC has expanded into the humanities as well, incorporating spatial and geographic analysis into history and literature classes. In that regard, the Center helps students to fulfill one of the “modes of thinking” requirements in Barnard’s new Foundations curriculum, introduced last fall, which requires students to take at least one course that utilizes quantitative and empirical analysis. Rather than having humanities students take a course outside of their interest in the sciences or social sciences, the ERC has been working with faculty in the humanities to incorporate empirical data into their classes, particularly through spatial analysis and GIS techniques.
Former graduate fellow Rachael Dottle ’16, GSAS ’17 has specialized in designing GIS workshops. In her work with Professor Yvette Christiansë’s Africana studies class about Harlem, students read books about the neighborhood before taking a driving tour of the neighborhood, a community they then learned to represent visually. “Everyone marked down the places we saw, and then they were able to collaborate on a map to see how these landmarks changed over time,” Dottle says.
For a seminar on the archaeology on the Southern Levant taught by Classics & Ancient Studies Assistant Professor Ellen Morris, Dottle and Rod helped lead workshops that allowed students to utilitize the mapping software QGIS to create maps to track subregions over 5,000 years of history. “Last time I taught the seminar, students had a difficult time connecting with their region in a meaningful way, as they were mostly looking at very basic maps with dots on a white page,” says Morris.
By contrast, with Rod and Dottle’s help, students were able to create a base map with natural features and plot locations of walled towns, shrines, cemeteries, and other features. This allowed the students to understand the underlying logic that drove change in their areas over time. “The students engaged with the peculiarities of their region in a much deeper way than they ever had previously,” says Morris. “It was fascinating to see how cultural and environmental changes had profound effects on the distribution of sites.” The workshop also helped train Morris in using the software for other classes, and even in her own research. “As a result of the seminar, I was able to create my own maps for a book that will be published next year,” she says.
Developing Confidence
Originally funded by a five-year Mellon grant, the Center was always intended to become a permanent fixture on campus. This year, its staff has expanded to include eight research fellows. The Center is also hiring a new lab coordinator, in part to increase outreach to Columbia faculty in order to integrate workshops into their classes. (Some Columbia students are already utilizing the Center for walk-in visits.) With ERC’s expanded scope, Weiman and Rod hope to make the Center a model for other undergraduate liberal arts colleges. This year, Barnard will host the National Numeracy Network conference; several faculty members will lead a discussion among directors of other centers who might be inspired by Barnard’s approach.
 Excelling at Excel
According to Rod, the majority of the Center’s work over the last five years has been to train students in Excel. “There is a perception students already know how to use Excel, but that is not the case,” Rod says. She even recalls an experience teaching a workshop at a recent junior colloquium in urban studies, where the majority of students had never even used the program. “That was shocking to me,” Rod admits.
Thankfully, there is some indication the ERC’s trainings have paid off. Three years ago, half of all walk-in visits to the Center were for assistance with Excel. By last year, that number had dropped to 35 percent, and this year, it is down to 20 percent. At the same time, requests to use more advanced programs, such as R, an open-source program for statistical computing and graphics, have increased.
The biggest step for students in learning more complex software platforms is often overcoming self-doubt about their ability to use them. “We spend a lot of time telling people, it’s not like we woke up and knew how to use Excel,” says Rod. “You have to train to do this.” Once students overcome their reservations and take the plunge, however, it’s often surprising how quickly they advance. “In the very beginning, we see people struggling even to install the software,” says Solow-Collins. “It’s so terrifying and overwhelming to them, they have no idea where to start.” By the next semester, the same students come into Center asking to create a chart for a paper even when it isn’t required.
Overcoming fear was a major undertaking for junior Shannon Galiotto ’19, who first encountered the ERC in Weiman’s Introduction to Economic Reasoning course. “I remember going in to ask about how to merge a cell in Excel, which at the time was completely over my head.” After patient explanation by Dottle and Solow-Collins, she began exploring more advanced functions in the program. “They helped me realize that Excel wasn’t some unconquerable tool,” she says. Now she is a computer science major and an ERC fellow herself. “The most important thing we are able to give students is an understanding of the tools they are using,” Galiotto says. “That way, when they encounter a similar problem in the future, they feel comfortable enough to work through it and discover the answer themselves.”
In part, that can mean overcoming gender stereotypes about women and technology. During her tenure, Solow-Collins says, research fellows noticed that male Columbia students were more likely to come in with a research question ready, while female students were more hesitant. “They would say, ‘I am bad at computers, I am not good at math.’ ” Being aware of that difference helped fellows be more reassuring up-front, reminding students that the key to success was not confidence in using technology but rather confidence in their ability to learn, something Barnard students have in abundance. The Center has also incorporated feminist themes into some workshops, for example, using a data set on how much films with female leads earn at the box office. “We are talking about issues that matter to women,” Solow-Collins says. “And showing them a new tool set for data analysis that can help in the fight for equality.”
Part of the reason that the ERC is able to set students at ease is that their peers staff the help desk and lead many workshops. “The social barriers you usually worry about breaking during a professor’s office hours usually aren’t there,” says environmental policy major Seyi Olojo ’18, who used the Center last year to help her map GIS data for a project she is working on in Black Rock Forest, sixty miles north of New York City. “Initially, I was nervous because it was the first time I had to open up my research to someone outside my immediate team,” she says. But fellow Carolyn Silverman ’17 walked her through the project and helped her create graphs in Excel in 45 minutes that Olojo had been laboring over for a week. The visualization ended up being the centerpiece of her poster when she presented her research that summer.
The most important lesson she’s learned from the ERC, Olojo says, is to take a step back and figure out the right questions to ask before determining the right software for the job. “I think oftentimes when it comes to empirical research, students get super-excited and skip a ton of exploratory steps,” she says.
That training to step back and think through a question is key to the way the ERC operates. “The ERC is, first, a place where you learn how to think, and, second, a place to learn how to translate ideas into action,” says Hannah Yoo ’19, a math and computer science major who first encountered the ERC in a course on programming behavioral sciences. This summer, Yoo was named a Clare Boothe Luce Scholar in the Columbia Department of Economics, where she is building a complex model to analyze market trading strategies. The project is a continuation of one she began in her Programming Behavioral Sciences course, with ERC’s help. “I had a strong foundation of how to think about the problem and organize and analyze the data from my ERC visit,” she says.
Preparing for the World
More and more, ERC staff and faculty are seeing students come to the Center for consultation on projects they are working on independently. “Knowing they can turn to the ERC makes students more willing to engage in original research,” says Assistant Professor of Political Science Katherine Krimmel, who has included the ERC in several classes to help students visualize political parties’ positions on issues and to understand polling data in real time. “Since I began working with the ERC, more students have been incorporating primary data analysis into their research projects.”
In some cases, those projects fall outside traditional, data-heavy disciplines. Dance major Falls Kennedy ’17 approached the ERC for assistance on her dance thesis, in order to compare how the Museum of Modern Art and the New York City Ballet were educating and engaging with young audiences. With the Center’s help, she aggregated data from IRS 990 forms and LinkedIn to chart revenue, expenses, and hiring patterns, in order to examine the factors that might be affecting that engagement and to support the importance of funding to help engage young audiences. “Dance is ‘the stepsister of the arts,’ often the last art form to receive money and the first to get cut with budget cuts,” Kennedy says.
Now an analyst at consulting firm Accenture, she hopes in the future to further study data from nonprofit disclosures and other sources to analyze how dance organizations can increase audience reach and participation. “As I have learned through my work with the ERC, using data is an incredibly useful tool that can help choreographers and administrators alike to better look at hiring patterns and to make claims for funding.”
Other students and research fellows have also translated the skills they learned through the ERC into their future careers. Arsen, now studying at the Harvard T.H. Chan School of Public Health, worked this past summer with managed health-care provider Kaiser Permanente to analyze patient data and hopes to continue to analyze health system data to inform strategy and improve patient outcomes. Dottle now works as an associate visual journalist and web developer for FiveThirtyEight, the news website known for its election polling analysis. During the recent debate over health care, for example, she created maps to visualize congressional voting patterns, insurance company distribution, and opioid deaths, in order to shed light on the details.
The skills she learned at the ERC help her not only with her own projects but also in teaching others how to visualize data. “If a writer has a data set, I might provide them with recommendations on how to best visualize it,” she says. “Or I might find a data set for a writer to help them illustrate their topic.”
While the primary purpose of the ERC is to better prepare students for their classes, it’s no accident that it is better preparing them for life after graduation as well. The skills in analyzing and visualizing data they learn can help them in all aspects of work. “This is not only for students going into finance,” Weiman says. “You can use these data skills no matter what walk of life you are in, whether you are going into business school or the nonprofit world.”
Recently, the ERC has been expanding its efforts to integrate data analysis by giving workshops for alumni groups, and it is currently exploring new offerings through the career development office. By giving students a firm background in analyzing empirical data and presenting it in the most compelling way, the ERC is preparing them to go out into a world where data is increasingly prevalent, and relevant, in every field.