Making a monthly budget and sticking to it, or deciding if paying for extra legroom or priority boarding when purchasing an airline ticket is worth it, are decisions that many have faced — and both are examples of economics. Yet this discipline, which has such a strong presence in everyday life, is often seen as inaccessible and difficult.
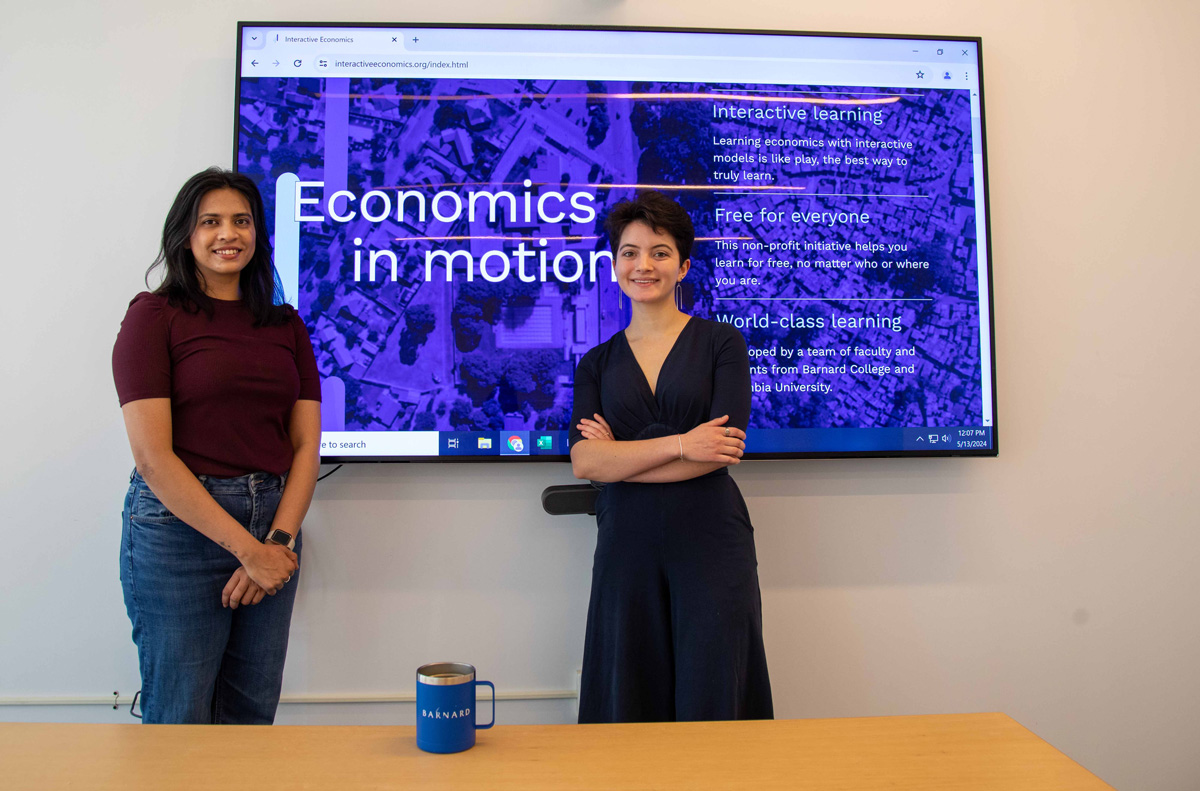
Fortunately, two Barnard professors and a group including Barnard students and alums have created Interactive Economics, a website that seeks to eliminate the fear surrounding economics by making learning it easy and accessible. The site — which calls itself “part teaching tool, part playground” — offers free, virtual interactive tools that demystify the discipline by giving real-life examples of exchanges between people, money, and the environment.
“There are many online learning tools, including websites and videos, but as far as I know, none of them feature the level of interaction and real-time feedback that we have managed to achieve,” said Rajiv Sethi, the site’s co-director and Barnard professor of economics.
The idea for Interactive Economics, which launched last month, dates back more than a decade. “This was an outgrowth of our work with the CORE Project, from 2013. We wanted to create high-quality open-access resources available free of charge worldwide to help people learn economics in a way that facilitates depth of understanding,” explained Sethi.

In order to create the virtual tools, Sethi and co-director Homa Zarghamee, associate professor of economics, recruited people who would likely be most impacted by it: students and recent graduates. Eight Barnard undergraduates and five graduate students worked with the professors on nearly every aspect of development. (Three of the students are New Pathways Bridgewater Scholars, and alumna Sondra Helene Plotnik-Sherry ’21 graduated through the Accelerated 4+1 Pathways.) They took on a variety of crucial tasks, including writing the code that underlies the interactive elements, editing and testing, and managing social media and distribution.

“The opportunity to contribute to Interactive Economics presented itself as the ideal chance to stay connected with the Barnard economics community while [using] my technical skills to create a product that presents the power to generate a direct, positive societal impact,” said Inés Perez ’23. Perez became involved with the project while collaborating with Sethi as a graduate student at Columbia’s Graduate School of Arts and Sciences (GSAS) and worked on the back-end development, including coding interactive visualizations.
Olivia Bobrownicki ’24 was tutoring for Barnard’s Economics Department when she first learned of the site last spring. Today, she is the head research assistant, coordinating content development efforts. “Interactive Economics is special because it’s for anyone,” she said. “It doesn’t matter if you’re a student, a teacher, or just a curious reader. Our writing is meant to be relaxed and relatable. Users can play with numbers and explore decades of real data for almost any country in the world. If they want, they can even dig into technical math to gain a deeper understanding of technical concepts. We want to excite and engage learners, no matter their stage of education.”
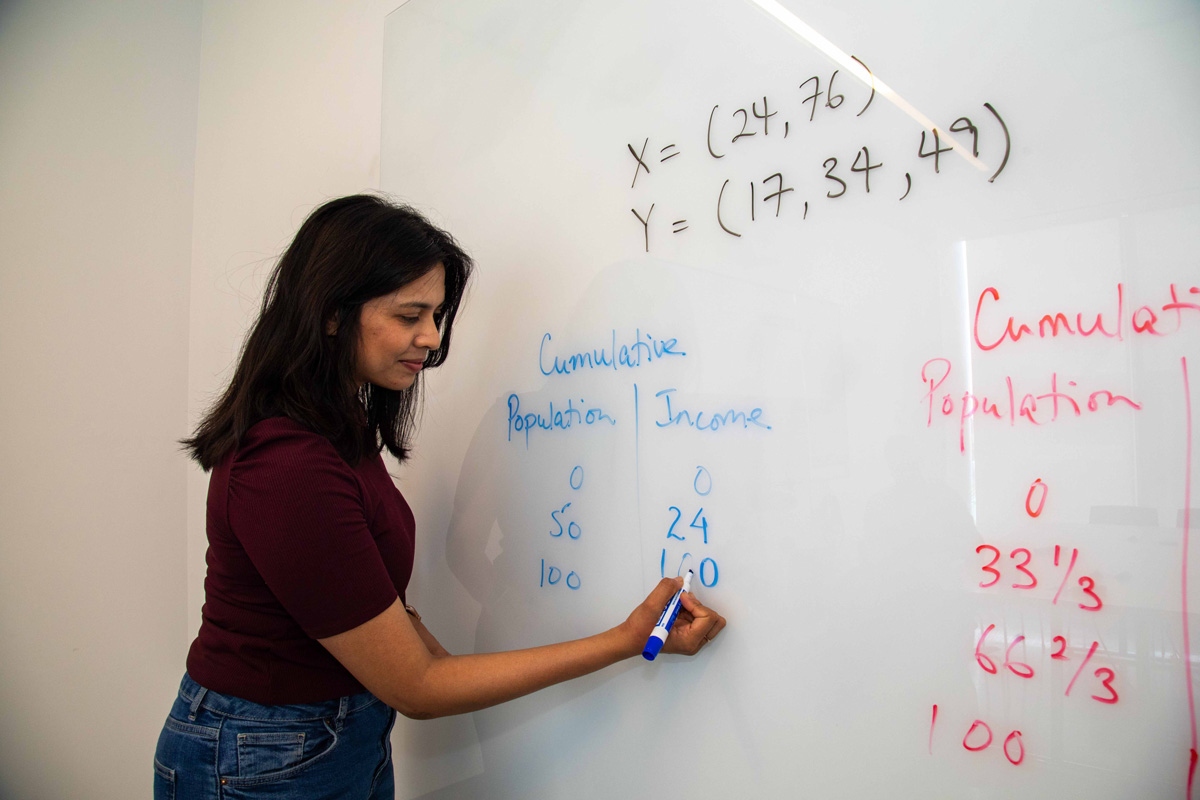
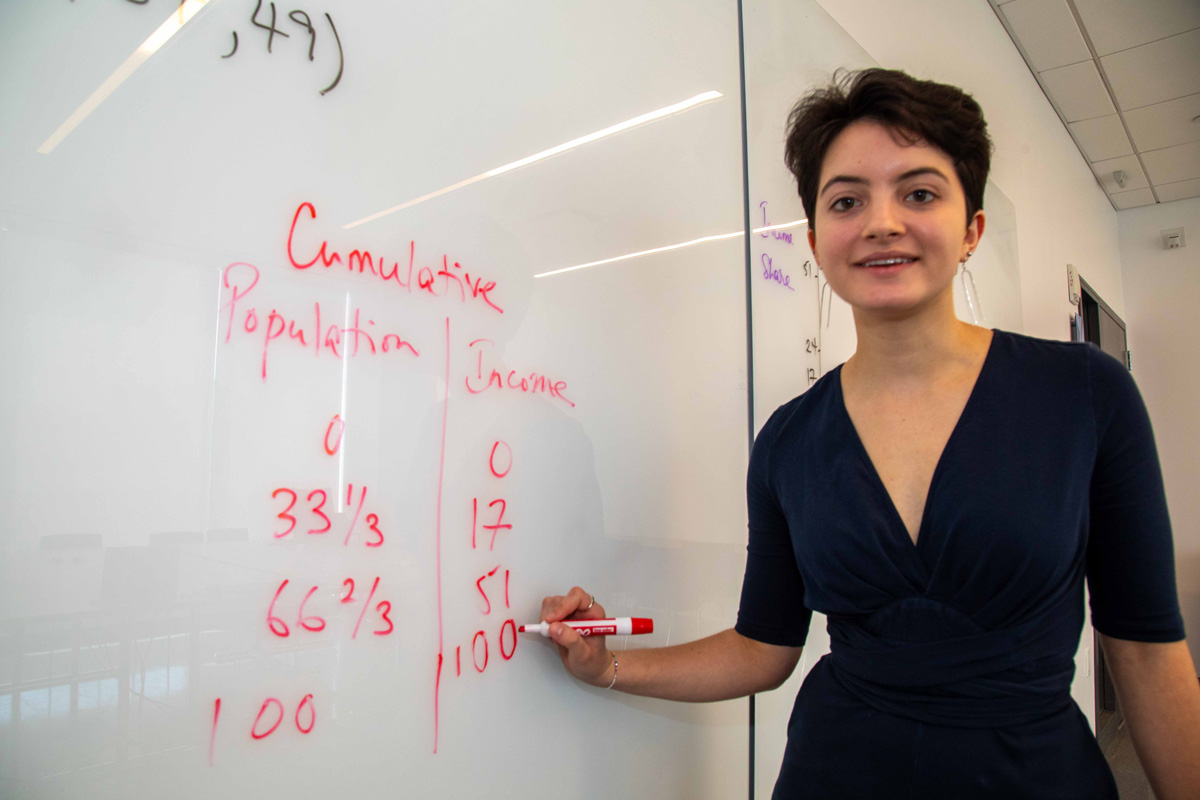
The website accomplishes this through seven modules and topic areas: Measuring Inequality; Specialization and Trade; Measuring Output, Inflation, and Growth; Technology and Costs; Aggregate Production and Fiscal Policy; Intertemporal Choice; and Balance Sheets and Trading. While these are all standard areas in economics, they are presented in a way that the user can play with data or models to broaden how they see economics — and learn it.
“There are multiple intended audiences — students in classes who may be struggling to understand technically demanding material, faculty who find the tools useful as teaching supplements, and people at all stages of life who just want to learn things at their own pace and in their own time,” said Sethi.